We have spent a good deal of time solving quadratic equations, where we found
the "points" that were the roots of the equations (and the zeros of the graphs).
Solving quadratic inequalities is very similar to solving quadratic equations,
except that we are now searching for "intervals" (or "regions") instead of specific points.
|
Like linear inequalities, quadratic inequalities may contain one variable or two variables.
Let's check out some examples.
Our solutions are going to be expressed in
"interval notation".
|

|
Solve the quadratic inequality x2 - 3x - 10 > 0.
(one variable inequality) |
| "Solving a quadratic inequality" will find "intervals of numbers" as its result. |
 Number Line Process: Number Line Process:
Let's take a look at the steps in this process.
1.
If needed, move all of the terms to one side of the inequality, with zero on the other side.
This equation is all set to go.
2. Replace the inequality with an equal sign.
Solve for the roots of the equation.
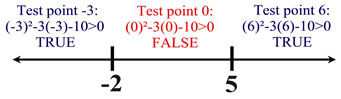
Roots are -2 and 5. These root values become "critical" values to solving the inequality.
3. Set up a number line to investigate the "intervals" created by the equation solutions.
Pick a number in each interval and test it in the inequality. If the result is true, that interval is a solution to the inequality. There may be more than one interval which is a solution.
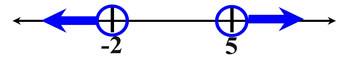
4. Graph the solution set on a number line.
Since this is a "strict" inequality, open circles are used. Arrows indicate where the inequality is true. State the solution in a form directed by your teacher or stated in the question.
Interval notation: 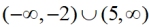 |
x2 - 3x - 10 > 0
Ways to State the Solution:
x < -2 or x > 5

|
 |
The number line, that was used in the example above, can be associated with the x-axis of the associated quadratic function.
Let's look at another approach to solving this same quadratic inequality.
|
Associated Function Process:
Let's take a look at this alternative approach.
First, remember what we know about quadratic function graphs, y = ax2 + bx + c.
If a > 0, the graph opens up.
If a < 0, the graph opens down. |
We start the same way:
1.
If needed, move all of the terms to one side of the inequality, with zero on the other side.
2. Replace the inequality with an equal sign.
Solve for the roots of the equation (which are the zeros of the function).
3. Picture the parabola that is associated with this quadratic.
Since a > 0, the parabola opens up, as it passes through the two zeros.
Solution in interval notation:
|
x2 - 3x - 10 > 0
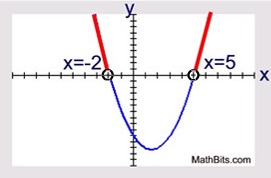
This is the graph of the associated quadratic function.
It is not the graph of a quadratic inequality.
Since the graph opens upward,
the graph is positive to the
left of -2 and also to the right of 5.
The graph is negative between -2 and 5.
Solution: the quadratic is >0 when
x < -2 and x > 5
|
|
In Example 1 (above), x was the only value that was being considered. But in Example 2 (below), we will be "graphing the quadratic inequality", meaning we will be dealing with the relationship of x-values and y-values in the coordinate plane.
|
|
Graph the quadratic inequality y < x2 - 3x - 10.
(two variables inequality) |
| "Graphing a quadratic inequality" will find a "region in the coordinate plane". |
While "solving the quadratic inequality" dealt with the quadratic in relation to "0", the graph of a quadratic inequality deals with the relationship of x-values to y-values.
1. Replace the inequality symbol with an equal sign, and graph the equation (a parabola). Use a dashed line for strict inequalities.
2. Choose a test point NOT on the parabola. Test the point in the inequality. If the result is true, shade the entire "region" where the test point lies (bounded by the parabola). If the result is false, shade the entire "region" on the other side of the parabola.
3. Solution: The shaded area contains all of the points that make the inequality true. |
 The point (0,0) tests FALSE in this inequality. The point (0,0) tests FALSE in this inequality.
0 < 0² - 3(0) - 10 is false.
|
A couple of special inequality situations to keep in mind.
What happens with a repeated root?
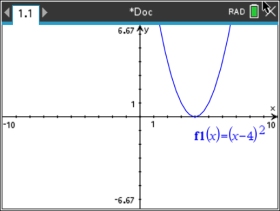
With a repeated root, there is only one point on the x-axis which is the vertex of the parabola. Since the vertex is the minimum (or maximum), all other y-values are positive (or all negative).
Consider the graph of y = (x - 4)2.
The solution to (x - 4)2 < 0 would be no solution.
The solution to (x - 4)2 < 0 would be {4}.
The solution to
(x - 4)2 > 0 would be all reals except 4.
The solution to
(x - 4)2 > 0 would be all reals.
|
Such inequalities have 4 possible options. |
What happens with complex roots?
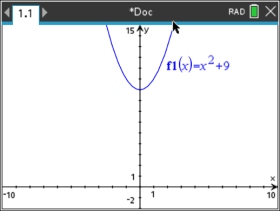
With complex roots, the graph lies completely above (or below) the x-axis, and there are no real zeros.
For example, the graph of y = x2 + 9 lies completely above the x-axis. having only positive values for y.
As a result, the expression x2 + 9 < 0 has no solution (Ø) -
(no points on this graph lie below the x-axis),
Whereas the expression x2 + 9 > 0 has all real numbers as its solution (-∞,∞) - (all points on this graph lie above the x-axis). |
Such inequalities have 2 possible options. |
|
For
calculator help with graph
quadratic
inequalities
click here. |
|
|
|
For
calculator help
with solve
quadratic
inequalities
click here. |
|
|
|
How to use your
TI-84+ graphing calculator to graph quadratic inequalities.
Click calculator. |
|
|
|