|
You worked with "relations" and "functions" in Algebra 1.
Let's refresh those skills and add a few more details.

A RELATION
|
|
A "relation" is simply a set of input and output values, represented in ordered pairs. It is a relationship between sets of information. |
|
Any set of ordered pairs may be used in a "relation".
No special rules need apply to a relation.
|
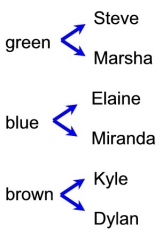
Consider this example of a "relation":
The relationship between eye color and student names.
(x,y) = (eye color, student's name)
Set A = {(green,Steve), (blue,Elaine), (brown,Kyle),
(green,Mike), (blue,Miranda), (brown, Dylan)}
Notice that the x-values (eye colors) get repeated.
Set A is a "relation".
|
 |
Graphical displays of relations:
The scatter plot and the continuous graph, shown below, are graphical displays of relations.
Note that these displays allow for one x-value
to have more than one corresponding y-value.
Points such as (1,1) and (1,2) can BOTH belong to the same relation.
Drawing vertical lines "points out" that there are x-values with more than one y-value.
 Relation:
Defined by an set of ordered pairs.
{(1,1),(1,2),(3,3),(4,4),(5,5),(5,6),(6,4)} |
 Relation:
Defined by quadratic equation:  Allows for
(2,1.414) and (2,-1.414). Allows for
(2,1.414) and (2,-1.414).
|
The vertical lines drawn on the graphs make it clear when an x-value has more than one y-value.
If vertical lines intersect the graph in more than one location, you have a "relation", but not a function.
A FUNCTION
If you add a "specific rule" to a relation, you get a "function".
|
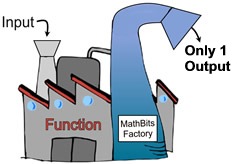
A function is a relation (a set of ordered pairs) in which each
x-element has only ONE y-element associated with it.
|
|
 |
While a function may NOT have two y-values assigned to the same x-value,
it may have
two x-values assigned to the same y-value.
NOT OK for a function:
{(5,1),(5,4)} |
OK for a function:
{(5,2),(4,2)} |
Function: each x-value has only ONE y-value! |
 I M P O R T A N T !! I M P O R T A N T !!
Those vertical lines we saw in the graphs above, come in handy
when trying to determine if a graph represents a function.
|
Vertical line test for functions: Any vertical line intersects the graph of a "function" in only ONE point. |
|
Let's adjust our previous examples so they fit the function "definition".
One way to adjust the "eye color" example to fit the definition of a function.
Set A: Eye Color:
"Relation"
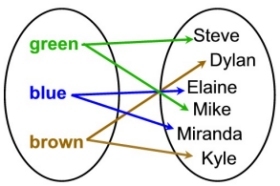
Allows for an x-value to have more than one corresponding y-value. |
Set B: Eye Color
"Function"
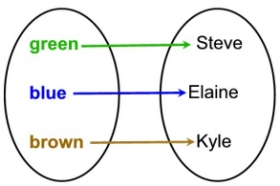
Allows for an x-value to have one, and only one, corresponding y-value. |
One way to adjust each graph to make it a function:
If we remove ( 1,2) and ( 5,6),
we will have a function.  Function:
{(1,1),(3,3),(4,4),(5,5),(6,4)}
 eliminate (1,2) and (5,6) eliminate (1,2) and (5,6) |
If we change the ± sign to just a + sign,
we will have a function.
 Function:
  eliminate the
bottom section of the graph
eliminate the
bottom section of the graph |
This time, the vertical lines drawn on the graphs intersect with the graphs in only one y-value.
If vertical lines intersect the graph in only one location, the relation is a "function".
See
"Restricting Domains" for more information on adjusting relations.
 |
Functions are one of the most important
concepts in mathematics.
The diversity can be seen in a range of vocations and areas of study.
As such, functions can present themselves in a variety of formats,
including descriptions, tables, equations and graphs. |
Let's see how these formats can be demonstrated in a problem.
| Taylor signs up for an on-line reading and listening service. The charge will be a set monthly fee of $9.95 in addition to a fee of $0.55 for each download. |
a) "Describe" this monetary monthly function.
The function, representing monthly cost, will be such that each download entered will be multiplied times $0.55 and added to the set monthly fee of $9.95.
b) Set up a "table" of this function based upon the number of downloads per month.
| # of Downloads (x) |
0 |
10 |
25 |
40 |
55 |
| Monthly Total (y) |
$9.95 |
$15.45 |
$23.70 |
$31.95 |
$40.20 |
c) Express this function as an "equation".
y = 0.55x + 9.95
d) Create a "graph" to include downloads from 0 to 60.
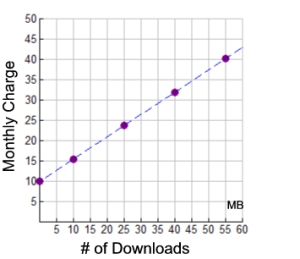 |
Since this is a
"real world" example, you need to be aware of what this graph is representing, and which components of the graph may not reflect "reality" in this setting.
The x-values represent the number of downloads of magazines, music, or books. You cannot download a fractional part of any of these items.
So, the graph is not a continuous straight line. It is actually a scatter plot (a discrete graph) with a domain of x being integers greater than or equal to zero.
|
|
Calculators like to graph functions! |
|
| Some calculators are able to graph only functions, and cannot graph relations. |
CONSIDER ... what about y2 = x ?
If we solve for "y =", we get , which we saw, at top of this page, was not a function.
Most calculators cannot graph y2 = x as a single entry.
We were not able to solve this equation for a unique (only one) "y =" equation.
We actually have two "y =" equations: and  . .
(Yes, the graphing calculator can graph these equations separately to form the graph.
But the combined graphs will be a relation, not a function.)
The lack of a unique "y =" equation means that y2 = x is not a function.
Certain calculators (including the TI-84+ series) will only "graph" functions.
And the function equation must be in "y = " form in order to enter it into the calculator.
It may be possible to "draw" (not graph) relations (non-functions) on these types of calculators.
Other calculators, like the TI-Nspire series, can graph both functions and relations. |
NOTE: The re-posting of materials (in part or whole) from this site to the Internet
is copyright violation
and is not considered "fair use" for educators. Please read the "Terms of Use". |
|