Graphing a linear inequality is just an extension of graphing a straight line! |
 |
|
An inequality written in the form Ax + By < C (where A and B are not zero), is called a linear inequality in two variables. |
 Steps for Graphing a Linear Inequality (in two variables)
• Isolate y to one side of the inequality (if necessary).
• Replace the inequality symbol with an = sign to create an equation.
• Graph the straight line of the equation. (This will be the boundary line of the inequality graph.)
• Draw the line dashed if you have a "strict" inequality (less than or greater than).
• Draw the line solid if the inequality is less than or equal to or greater than or equal to.
• Choose a point not on the line as a test point. The point (0,0) is an easy point to test, as long as it is not on the line. The test point will lie in one of the half-planes formed by the boundary line.
• If the test point makes the inequality true, shade that side of the line (shading over the point). If the test point makes the inequality false, shade the other side of the line (not shading over the point). |
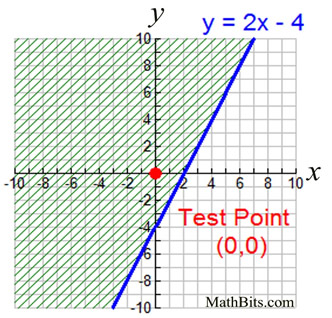
 Graph the inequality
1. The inequality already has y isolated.
2. Graph the straight line y = 2x - 4. The line is drawn solid since the inequality is greater than or equal to.
3. Pick a test point not on the line.
The point
(0,0) was used in this example.
4. Check the test point:
5. The test point gave a true result, so the graph is shaded on that side of the line (so that the shade will cover the test point).
|
|

 Graph the inequality 4y < -2x - 12
1. Isolate the y value. Divide all terms by 4.
y < - ½ x - 3
2. Graph the straight line y = -½ x - 3. The line is drawn dashed since this is a strict inequality (less than).
3. Pick a test point not on the line.
The point (0,0) was used in this example.
4. Check the test point:
4(0) < 2(0) - 12
0 < -12 false
It is best to "check" into the original inequality, in case you made an algebraic error when solving.
5. The test point gave a false result, so the graph is shaded on other side of the line (so that the shade will NOT cover the test point).
|
|
Alternative View of Graphing Linear Inequalities
Since we are dealing with "linear" inequalities, we are dealing with straight lines,
which means we are dealing with y = mx + b.
After solving the inequalities to isolate "y" on one side of the inequality symbol,
we are dealing with one of four possibilities:
y < mx + b y > mx + b y < mx + b y > mx + b
Note: Instead of a "test point" to determine where to shade, some people use the idea of "above the line" or "below the line", as it correlates with "greater than" or "less than", to determine the region for shading.
If we combine the four inequalities above with how to shade the line and the region, we have:
| y < mx + b |
dashed straight line |
shade below the line |
| y > mx + b |
dashed straight line |
shade above the line |
| y < mx + b |
solid straight line |
shade below the line |
| y > mx + b |
solid straight line |
shade above the line |
Keep in mind that if you get confused with where the "above the line"
or "below the line" may be located,
you can use a "test point" to guarantee you are shading the correct section of the graph.
 The graph of a linear inequality is always a "region" of the
plane
(a "half-plane") bounded by a straight line.
|
How to use your
TI-83+ graphing calculator to graph linear inequalities.
Click calculator. |
|